When it comes to marketing automation, KPIs are more than just numbers—they’re the compass that guides your strategy towards data-driven success. But how do you ensure you’re tracking the right metrics, and more importantly, using them to drive actionable insights?
In this guide, we’ll walk you through a step-by-step process for mastering marketing automation KPIs, from aligning them with your business goals to implementing them with the right tools. Whether you’re new to KPIs or looking to refine your approach, these strategies will help you turn data into decisions that propel your marketing efforts forward. Ready to optimise your KPIs for maximum impact? Let’s dive in.
- Align KPIs with Business Goals: Start by ensuring your KPIs are directly tied to your business objectives, providing a clear line of sight between marketing efforts and overall company success.
- Implement SMART Framework: Use the SMART framework to set KPIs that are Specific, Measurable, Achievable, Relevant, and Time-bound, ensuring they are both actionable and realistic.
- Use the Right Tools for Tracking: Integrate tools like Google Analytics and HubSpot to effectively track and manage your KPIs, making data collection seamless and analysis more insightful.
- Regularly Review and Adjust: Continually monitor your KPIs using dashboards and reports, and be prepared to adjust your strategies based on the data insights to stay aligned with business goals.
- Avoid Common Pitfalls: Focus on meaningful KPIs rather than vanity metrics, and avoid overwhelming yourself with too many KPIs—prioritise those that truly impact your bottom line.
- Commit to Continuous Improvement: Regularly update your benchmarks and refine your marketing strategies based on KPI insights, ensuring your approach remains dynamic and effective.
Key Performance Indicators within Automated Marketing
A Key Performance Indicator (KPI) is a measurable value that demonstrates how effectively a company is achieving key business objectives. These KPIs span various aspects of business, including financial, marketing, sales, and operational domains.
KPIs are essential metrics that evaluate overall performance over time. To effectively analyse and report on your KPIs, creating custom dashboards in your marketing automation software is highly recommended.
Why You Need to Set Up Sales KPIs
Measuring the right Key Performance Indicators (KPIs) is crucial for the health and success of your business. When we onboard new clients, we often find that they are unsure about what they should be measuring and how to utilise these powerful tools effectively.
KPIs provide more than just weekly reports; they offer insights into the performance and health of your business, enabling critical adjustments to achieve strategic goals. Understanding and tracking the right marketing automation KPIs will expedite your results.

Benefits of Using KPIs
- Monitoring Company Health: KPIs act as a scorecard for your company’s health. You only need a select few KPIs to monitor vital signs. Focus on measuring what you aim to improve, so you can channel energy into areas where you want to effect change. It’s beneficial to measure KPIs in four categories: Employees, Customers, Processes, and Revenue. These categories encompass disciplines such as human resources, customer satisfaction, business processes, and business strategy. Initially, choose the right KPIs for your business, then determine accountability for them.
- Measuring Progress Over Time: Track key result indicators like Revenue, Gross Margin, number of locations, and number of employees. Set targets at the beginning of each year and quarter, and use KPIs weekly to gauge your progress towards those goals. Setting the right KPIs helps you monitor your progress towards long-term goals and business strategy.
- Making Adjustments & Staying on Track: Alongside your results, you need leading indicators to alert you when you might miss targets before it’s too late. Leading indicator KPIs help predict future outcomes. They indicate if you are on track to achieve desired results and possess two key characteristics: they are measurable, and you can directly influence them. These are valuable KPIs to have on your dashboard to keep projects on track.
- Solving Problems or Tackling Opportunities: Use a combination of KPIs in a dashboard to have the right information at your fingertips for solving problems or seizing opportunities. For instance, if you are experiencing a sales slump, identify a handful of KPIs that can help you reverse the trend (e.g., number of outbound calls, appointments kept, trade shows attended). Track them weekly to determine if you’ve identified the right lever to generate more predictable sales. Alternatively, if you have a promising idea for a new product, test it with a few clients and use KPIs to validate your business model before a large-scale launch. Monitor metrics such as number of customers interested, financial support for the new product, Net Promoter Score (NPS), implementation time, and number of defects.
- Analysing Patterns Over Time: By measuring the same KPIs quarter after quarter, you can begin to detect patterns in your data. These patterns can provide valuable insights for your business. For example, predicting when your slowest quarter will occur allows you to plan a system update or company-wide training initiative. You may notice that your sales manager consistently forecasts outcomes that are slightly off, which you can address to improve accuracy. Additionally, identifying team members who consistently underperform or overperform on their KPIs enables you to manage consequences, whether positive or negative.
By leveraging data-driven marketing automation and tracking relevant marketing automation KPIs, businesses can achieve more precise, actionable insights that drive growth and efficiency.
What Matters Most?
Aligning KPIs with customer journey stages is crucial to avoid tracking misleading metrics. Our clients often discover that traditional KPIs like open rates or click-throughs don’t provide the full picture when it comes to marketing automation’s impact, and instead, focusing on engagement depth and pipeline velocity better reflects lead movement through the funnel. Predictive analytics typically helps refine KPI targets, allowing companies to anticipate outcomes with greater precision.Get In Touch
What key metrics should I track to evaluate my marketing effectiveness?
Sales KPIs to Track and Measure
Marketing Automation Activity
Before delving into more intricate metrics, it’s imperative to ensure your marketing automation strategies are fully operational. If you’ve set it up and then metaphorically ‘flown off to Hawaii,’ it’s likely your team isn’t utilising the system to its full potential.
Here are two straightforward marketing automation metrics to verify if your strategies are being used effectively:
- Number of Emails Sent: The volume of emails sent by your team directly impacts the number of leads in your sales funnel. A low number of sent emails might indicate that your marketing automation is underutilised.
- Setup of Conditions and Commands: The adage “You plan to fail if you fail to plan” is especially pertinent when scaling your marketing goals. Sending numerous emails is futile if they are generic. It’s crucial to set up conditions and commands based on customer activity to personalise the messaging.
A practical example is the receipt email you receive from e-commerce stores post-purchase. While this may increase e-commerce operating expenses, it significantly boosts conversion rates.
Open & Click-Through Rates
Monitoring the open and click-through rates of your emails provides vital insights into your marketing strategy’s effectiveness. The open rate indicates how compelling your subject lines are, while the click-through rate shows how engaging your content and calls to action (CTAs) are.
In the realm of affiliate marketing, these metrics are doubly important. High open and click-through rates suggest that your messaging resonates well with your audience. Conversely, low rates necessitate a strategic overhaul.
Cost per Customer
This metric represents the expenditure required to convert a single lead into a customer. A lower cost per customer signifies efficient management of remote teams and successful lead conversion strategies.
Marketing Qualified Leads (MQLs)
MQLs are leads that are more likely to become customers due to their prior interactions with your marketing or sales team. An increase in the number of MQLs is indicative of effective marketing efforts.
Generated Revenue
Ultimately, the primary objective of any marketing strategy is to generate revenue. The revenue generated should ideally exceed the costs involved in implementing the strategy. Key indicators of generated revenue include the number of closed deals and the average sale price.
How do I effectively measure the success of my marketing automation strategies?
Are you wasting resources on marketing strategies that fail to deliver results? This is where marketing KPIs, or key performance indicators, become indispensable. KPIs allow businesses to assess the effectiveness of their marketing efforts, ensuring resources are optimally utilised.
There’s no shame in having marketing efforts that miss the mark. What’s crucial is measuring these efforts to identify what works and what doesn’t. Without measurement, you risk continuing ineffective strategies, squandering time and money.
Tracking key marketing KPIs can help you:
- Make informed business decisions
- Attribute revenue to specific marketing efforts
- Adjust unsuccessful strategies
- Identify cost-saving opportunities
- Discover what works best, thereby fostering business growth
Not all marketing efforts translate directly into revenue. Many aim to build brand awareness and familiarise potential customers with your business. Consequently, some marketing KPIs focus on financial metrics, while others do not. Nonetheless, all are critical for marketing and business success.
So, without further ado, let’s explore the five key performance indicators in marketing:
1. Return on Investment (ROI)
How much are you investing in marketing compared to the revenue it generates? ROI is a crucial metric that shows whether your marketing spend is yielding profits or losses. To calculate ROI, use the following formula:
ROI = (Sales Gain – Marketing Cost) / Marketing Cost
To determine your marketing cost, sum all your marketing expenses, including:
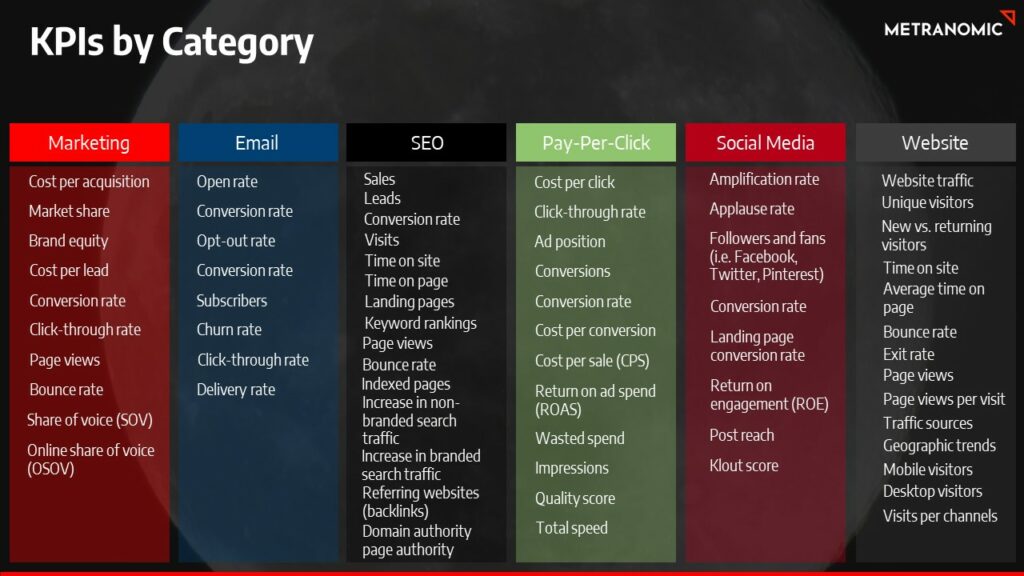
- Pay-per-click (PPC) advertising
- Supplies
- Advertisements
- Marketing employee salaries
If your ROI is low, consider reducing expenses or finding new ways to increase revenue. A high ROI indicates successful marketing efforts—keep up the good work.
2. Customer Acquisition Cost (CAC) and Customer Lifetime Value (CLV)
ROI isn’t the only financial metric to evaluate. Compare your customer acquisition cost (CAC) with the customer lifetime value (CLV). CAC reveals how much you spend to acquire each customer, while CLV shows how much a customer is likely to spend at your business over their lifetime.
If acquiring a customer costs more than their projected lifetime spend, it’s time to reassess your marketing strategy.
3. Website Traffic
Does your business have a website? Of course it does (and if not, now is the perfect time to create one!). Your website is an integral marketing tool, and evaluating its success is crucial.
Utilise tools like Google Analytics to ascertain how many visitors your site attracts. Identify which pages generate the most activity and capitalise on your high-performing pages by adding advertisements. Enhance low-performing pages with strategic keywords and compelling visuals.
You can delve deeply into website traffic analytics, breaking it down by organic (unpaid) traffic and paid traffic. Analyse the number of returning visitors versus unique visitors to uncover valuable insights. The analytical possibilities are extensive.
Additional website metrics to track include:
- Bounce Rate: The percentage of visitors who leave your site after viewing only one page.
- Click-Through Rate: The rate at which visitors click on links within your site.
- Time on Page: The average duration visitors spend on a page.
- Domain Authority: A metric indicating your website’s credibility and ranking potential.
- Site Speed: The loading time of your website, which affects user experience and SEO rankings.
4. Social Media Engagement
A study indicates that 90% of U.S. businesses utilise social media for marketing. If you are part of this majority, the pertinent question is: which KPIs should you track to measure your social media efforts?
Consider the following metrics:
- Likes
- Comments
- Shares
- Conversions
- Followers
It’s essential to remember that social media should not solely focus on marketing. If some KPIs are underperforming, it might be due to a lack of engaging and informative content. Experiment with different posting schedules and content types to improve these metrics.
5. Email Engagement
Are your emails being opened by current or potential customers? Are recipients clicking through them and performing the desired actions?
If you lack this insight, you could be wasting effort on ineffective emails. Email engagement metrics are crucial for understanding and enhancing your email marketing strategy.
Measure the percentage of recipients who open your emails, click on links within them, and convert to paying customers. Conduct A/B tests by sending different versions of an email to two groups to determine which performs better. This testing can reveal surprising insights into what resonates with your audience.
Test and measure engagement with elements such as:
- Colours
- Wording
- Email Subject Lines
- Discounts or Offers
- Visuals
By meticulously tracking these KPIs, you can optimise your marketing automation metrics, enhance your marketing automation KPIs, and leverage data driven marketing automation to drive significant improvements in your business performance.
Our Tactical Recommendations
From our experience, focusing on lead scoring adjustments as automation campaigns run often leads to improved qualification accuracy. We find that monitoring pipeline velocity—how quickly leads move through stages—directly correlates with automation effectiveness. We have seen firsthand how measuring opportunity conversion rate proves highly actionable; it provides a clear indication of how well automation contributes to closing deals. Testing CPA (cost per acquisition) also yields quick insights into the financial impact of automation, which many B2B leaders find invaluable when assessing ROI.Get In Touch
How can I choose the right KPIs relevant to my business goals?
Choosing KPIs Directly Related to Your Business Goals
KPIs, or Key Performance Indicators, are quantifiable measurements used to gauge your company’s performance relative to specific goals. For instance, a KPI might relate to increasing sales, improving return on investment in marketing efforts, or enhancing customer service.
To identify the right KPIs for your brand, start by asking:
- What are your company’s goals?
- Have you identified any major areas for improvement or optimisation?
- What are the biggest priorities for your management team?
Answering these questions will guide you towards selecting the most relevant KPIs for your business.
The Importance of Focusing on Key KPIs
When it comes to KPIs, prioritising a select few can be significantly more effective than trying to measure everything. Avoid the pitfall of tracking an excessive number of metrics, which can lead to data overload and a lack of focus.
Customising KPIs to Your Business
Each business, regardless of industry or model, has unique requirements, making it essential to tailor your KPIs accordingly. While it’s difficult to recommend a one-size-fits-all number of KPIs, aiming for two to four critical metrics per goal can help maintain clarity and focus.
Achieving Clarity with a Limited Number of KPIs
By limiting the number of KPIs to a manageable range, you ensure that your team remains focused on the most important metrics, thereby facilitating more precise and effective decision-making. This focused approach prevents the dilution of priorities and helps maintain strategic direction.
Consider Your Company’s Stage of Growth
Your company’s stage of growth significantly influences which KPIs are most relevant. Startups typically focus on metrics related to business model validation, whereas established organisations might prioritise metrics like cost per acquisition and customer lifetime value.
Identify Both Lagging and Leading Performance Indicators
Understanding the difference between lagging and leading indicators is crucial. Lagging indicators measure the output of past actions (e.g., total sales last month, the number of new customers). These metrics are valuable for assessing results but don’t provide predictive insights.
Leading indicators, however, measure the likelihood of achieving future goals. They act as predictors of what’s to come (e.g., conversion rates, sales opportunity age, sales rep activity). Leading indicators help you stay on track to meet your objectives and can be seen as business drivers, coming before trends emerge.
Traditionally, many organisations focus on lagging indicators because they are easier to measure. However, for a forward-looking strategy, integrating leading indicators is essential. By identifying the leading indicators that will impact future performance, you can significantly enhance your chances of success.


